Often we're in a social gathering at work or church and there are plates full of cookies, croissants, brownies or muffins. We'll often say "I'm not tempted by poison." Which usually solicits a strange response like, "What do you mean, poison?" We'll say, "If you knew what sugar does to your body, you'd see it for what it actually is -- a poison." The conversation then shifts to artificial sweeteners like Splenda® or Equal® and they begin to ask about our preference of sweeteners. "Do you like Stevia, agave, honey or what?" We then usually respond with, "Why does it have to be sweet?" That is the biggest question we have? Why are we all looking for a way to have our sweets? When did this begin? It seems like sweetness is a required nutrient or something, why is it so important to have 'healthy sweet snacks' when we're on a diet?? What we're proposing is a lifestyle, not a diet; dating back over 5,000 years. Only in the past 100 years we've introduced sugar for the common man. Most of the obesity and disease were only common among the rich dating back hundreds of years until now, everyone is dealing with a horrid list of diseases.
When you start to live a low-carb lifestyle, it is one of the toughest things to do. Not because of the self-control, but sugar is everywhere, hidden in many things. We plan to provide research, personal experience and testing tools to help you in your journey into a lifestyle full of energy for a long long time. The secret is fat.
A quote from a friend of ours, Judith, says it all, "Lots of kids get ear infections after eating lots of sugar and carbs, leading to the whole cycle of antibiotics, new infections and frequently resulting in tubes in the ears and auditory processing problems. How sad that we associate refined sugar with love."

This is us 1 month before we entered nutritional ketosis. We were both active, had been low carb, no breads, cereals for over 2 years. Some results, but still not getting where we wanted.
|

This is after 3 months of ketosis. Lynette wanted us to be in the same clothes so it's showing the real results. The amazing thing is, we weigh about the same. Tim has lost 10 lbs and Lynette lost 7 in that time.
|
Big disclaimer: We are not physicians, we are sharing our personal experiences with hopes to spark people to look into things for themselves. We have done years of research, testing on ourselves and reading many, many books. Since there are about seven billion people in the world, there are approximately seven billion different combinations of trillions of cells that make up the human race. There is no one-size-fits-all eating lifestyle; experiment to find your optimum diet. When we talk about nutritional ketosis, we are not talking about diabetic ketoacidosis, read this article to learn the difference. Physicians are still practicing too, so they are often wrong, but are finding their way with the best of intentions in most cases. Take personal responsibility for your healthcare and partner with a professional as needed.
Here is a research article that Lynette wrote for her English 1A class. Clearly, this was more than an English paper, but one of the biggest discoveries we've personally had. Dated 14 May 2008, it's probably worse now than it was 5 years ago.
The Sugar Bug - Part 1
May has arrived and the flu bug is sprouting wings to leave the Northern Hemisphere as the sugar bug is preparing to land in just a few short months. The confectioners and retailers are planning the advertising and promotions that will set the stage for the “big four” candy sales seasons. Candy will be merchandised at retail establishments for a minimum span of thirty-seven weeks in the next twelve months, covering over 70% of the year (Echeandia). The sales extravaganza will commence around September first in preparation for Halloween, which has the highest candy sales of the four holidays that also include Christmas, Valentine’s Day, and Easter (Dadisman; “Winter”). Halloween, currently the number one candy sales holiday at $2.2 billion, followed by Easter with $2 billion. The total candy sales for 2007 was $6.96 billion (“Nielson”; “Winter”). What a tremendous amount of sugar to be consumed in the span of one year. That consumption equates to approximately 24 pounds of candy for each man, woman and child in the U.S. (“Did”). The sugar bug has infected the people of America, which is in the midst of a sugar consumption epidemic. Within a year America will consume nearly 142 pounds of sugar, 61 pounds of high-fructose corn syrup, and 54 gallons of soda for each citizen (“One”; “How”).
When October arrives with the promotions for the biggest candy holiday of the year underway, the Centers for Disease Control and Prevention will tell the American people flu season has arrived once again. The American flu season will last two times longer than the rest of the world, and will peak following candy holidays because of the massive consumption of sugars.
To begin with, when is the American flu season and does the rest of the world suffer a flu season? Authors Kathleen O’Brien and Ian G. Barr define flu season in their “Annual Report of the National Influenza Surveillance Scheme, 2006” as follows: “Influenza infections are seasonal in temperate climates, more commonly occurring in the colder months (June to September in the Southern Hemisphere and December to April in the Northern Hemisphere) but may occur year-round in tropical regions” (O’Brien). Flu season is a worldwide event, however the Centers for Disease Control and Prevention, will chart and graph the American flu season focusing on the fortieth week of the year until about the sixteenth week of the following year, totaling twenty-eight weeks. According to the most recent charts for the years 2005 – 2008 (See Graph 1), flu visits at doctor’s offices begin building into a mountain about week thirty-six, generally around September first. This mountain on the graph continues until about the sixteenth week of the following year actually totaling thirty-two weeks in the entire season (“FluView”).
Graph 1
“FluView.” Centers for Disease Control and Prevention 2 May 2008. 28 Apr. 2008 <http://www.cdc.gov/flu>.
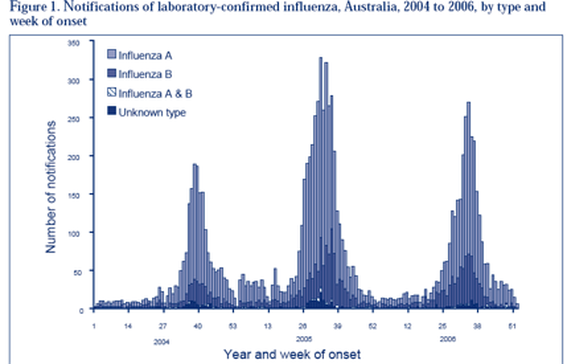
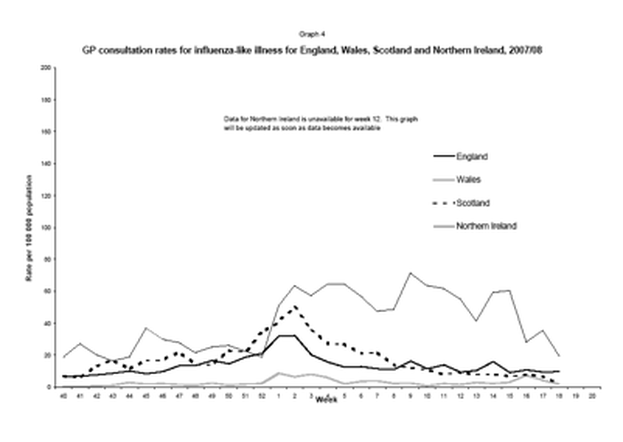
In comparison, the flu season in Australia is opposite that of America as it is in the Southern Hemisphere. It is charted by the Communicable Disease Intelligence beginning about the twenty-fourth week of the year, and continuing until the fortieth week of the year, totaling sixteen weeks (O’Brien). These weeks are the span of the mountains on the charts for the years 2004 – 2006 (See Graph 2). Also in comparision, the Health Protection Agency that monitors influenza in England, Wales, Scotland and Northern Ireland have published charts on their flu season, which is about twelve to sixteen weeks from late October until early February (See Graph 3) (“Influenza”). In summary, according to these government agencies the American flu season is normally thirty-two weeks, the Australian flu season is normally sixteen weeks, and the European flu season is normally twelve to sixteen weeks, leaving the U.S. with a flu season that is twice as long as the other nations.
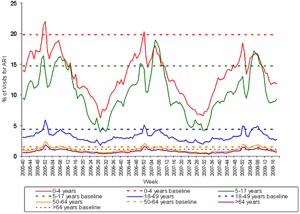
Because the U.S. is sick with the flu for a much longer period of time, what factors cause the flu season to be so much longer than other countries? When viewing Australia’s graph it quickly rises to a point and falls back down just as quickly over the period of weeks for flu season (See Graph 2). Also noteable in the Australian charts are the age groups most afflicted, which are ages 0 – 4 years and 70 years and older (See Graph 4) (O’Brien). In a manner very similar to Australia, the European charts follow a single peaked mountain format as a whole, but there are various spikes in rates of illness based on age. The age groups most afflicted by the flu are 15 – 44 year olds and those aged 75 and older (See Graph 5) (“Influenza”).
Graph 2 (figure 1)
In comparison, the flu season in Australia is opposite that of America as it is in the Southern Hemisphere. It is charted by the Communicable Disease Intelligence beginning about the twenty-fourth week of the year, and continuing until the fortieth week of the year, totaling sixteen weeks (O’Brien). These weeks are the span of the mountains on the charts for the years 2004 – 2006 (See Graph 2). Also in comparision, the Health Protection Agency that monitors influenza in England, Wales, Scotland and Northern Ireland have published charts on their flu season, which is about twelve to sixteen weeks from late October until early February (See Graph 3) (“Influenza”). In summary, according to these government agencies the American flu season is normally thirty-two weeks, the Australian flu season is normally sixteen weeks, and the European flu season is normally twelve to sixteen weeks, leaving the U.S. with a flu season that is twice as long as the other nations.
Because the U.S. is sick with the flu for a much longer period of time, what factors cause the flu season to be so much longer than other countries? When viewing Australia’s graph it quickly rises to a point and falls back down just as quickly over the period of weeks for flu season (See Graph 2). Also noteable in the Australian charts are the age groups most afflicted, which are ages 0 – 4 years and 70 years and older (See Graph 4) (O’Brien). In a manner very similar to Australia, the European charts follow a single peaked mountain format as a whole, but there are various spikes in rates of illness based on age. The age groups most afflicted by the flu are 15 – 44 year olds and those aged 75 and older (See Graph 5) (“Influenza”).
Graph 2 (figure 1)
Graph 3
“Influenza Graphs 07/08.” Health Protection Agency. 28 Apr. 2008 <http://www.hpa.org.uk/web/HPAwebFile/HPAweb_C/1194947338975>.
Go to Part 2
Go to Part 2